Best Greyhound Betting Sites – Bet on Greyhounds in 2026
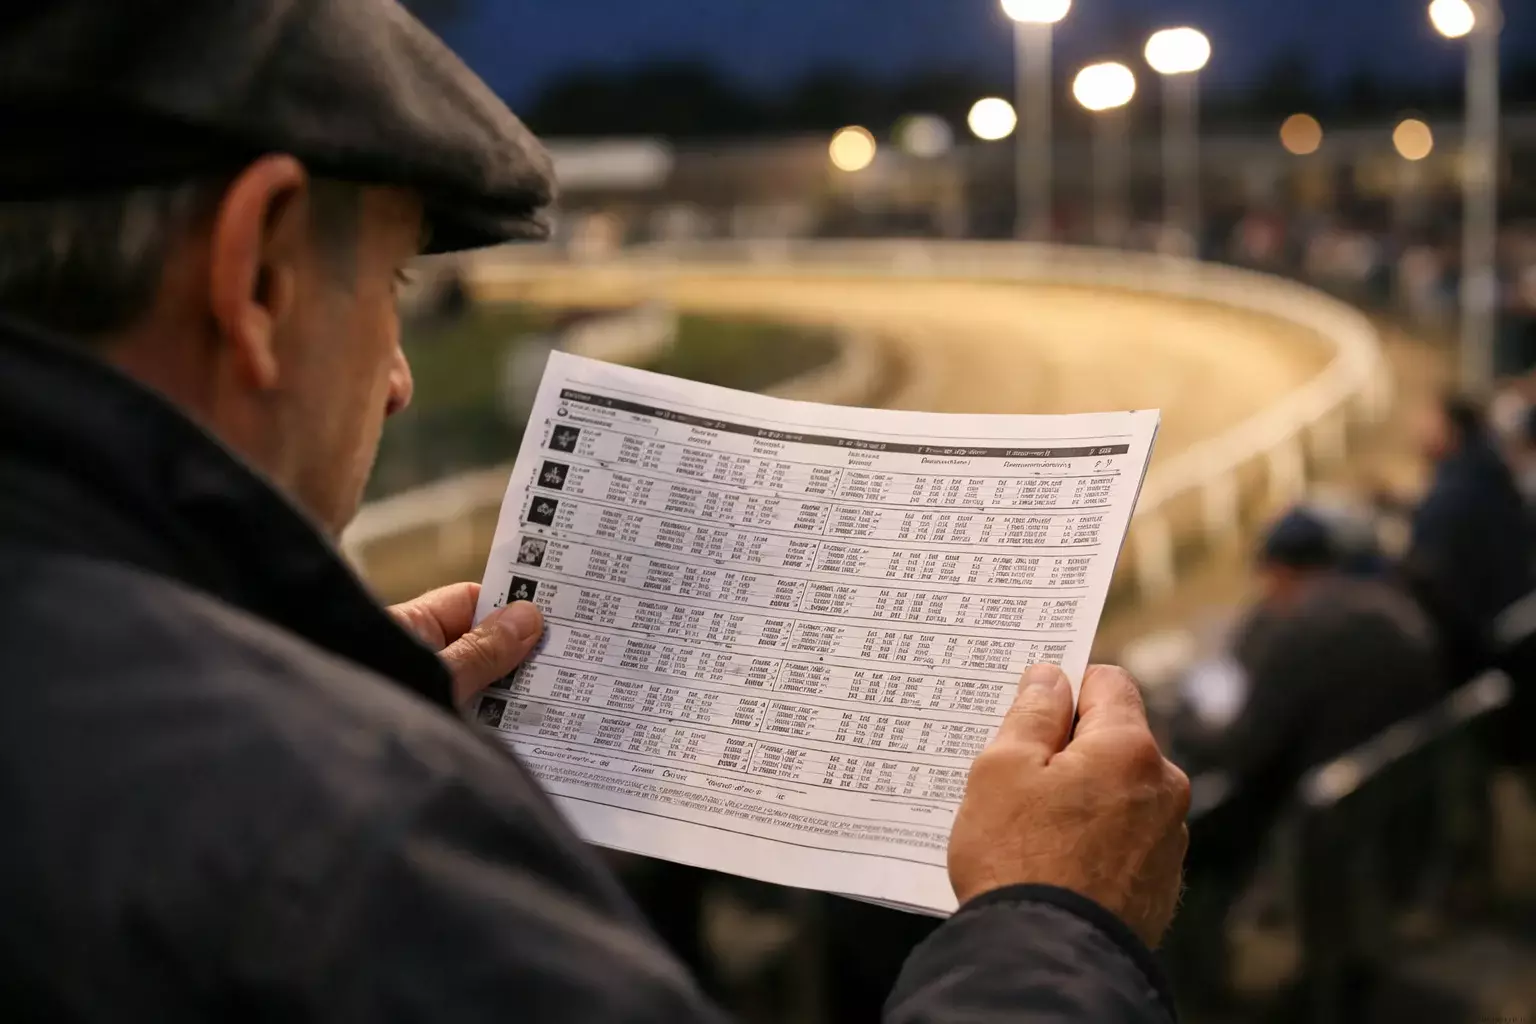
Learning how to read a greyhound racecard is the single most valuable skill any serious bettor can develop. Before placing a single pound on any race at Romford or elsewhere, understanding what the racecard actually tells you separates informed punters from those simply guessing at trap colours.
The racecard serves as a complete dossier for each dog in the race. It contains performance history, physical measurements, trainer details, trap assignment, and timing data that forms the foundation of race analysis. Every piece of information published serves a purpose, though deciphering what matters requires systematic study rather than casual glancing.
At Romford Stadium, London’s only operational greyhound track following Crayford’s closure in January 2025, racecards follow the standardised format used across all GBGB-licensed venues. Whether you’re looking at a Friday evening open race or a Tuesday morning BAGS meeting, the structure remains consistent. This uniformity means the skills developed here translate directly to any of the 18 licensed UK tracks.
This guide breaks down each racecard element methodically. You’ll learn what the numbers actually signify, how form figures reveal patterns invisible to untrained eyes, and why trainer statistics matter more than many bettors realise. Read the card, not the hype. The information to make better selections sits right in front of you, encoded in rows of data that most punters never properly learn to interpret.
Anatomy of a Greyhound Racecard
Every greyhound racecard presents information in a standardised layout, though the density of data can overwhelm newcomers. Breaking down each component systematically reveals how the pieces interconnect to paint a complete picture of each runner.
Trap Number and Colour
The trap number appears first, running one through six. Each corresponds to a specific colour: red for trap one, blue for two, white for three, black for four, orange for five, and black-and-white stripes for trap six. These colours appear on the racing jackets, making identification during the race straightforward. The trap position fundamentally affects race dynamics, particularly on bend starts where inside traps often hold advantages.
Dog Name and Registration
The greyhound’s registered name follows the trap assignment. Names can include prefixes indicating breeding or ownership affiliations. Beneath or beside the name, you’ll find the dam (mother) and sire (father) listed, providing lineage information useful for those who study breeding patterns. Some successful sire lines produce offspring suited to specific distances or running styles.
Trainer Name and Kennel
The licensed trainer responsible for the greyhound appears prominently. This information carries significant weight, as trainer strike rates vary considerably. Some trainers specialise in sprinters, others in stayers. Certain kennels perform exceptionally at specific tracks due to familiarity with particular characteristics. Romford regulars often develop preferences for dogs from kennels with strong track records at the venue.
Weight and Season
Current racing weight appears in kilograms, typically ranging from 25kg to 38kg for adult greyhounds. Weight fluctuations between races can indicate fitness changes or health issues. A dog racing significantly lighter or heavier than previous outings warrants attention. For bitches, the season status indicates whether she’s currently in season, which can affect performance and typically results in scratching from races.
Form String
The form string shows recent finishing positions, reading left to right from oldest to most recent. A sequence like 321456 indicates the dog finished third two races back, second last time, and won most recently before that. Understanding form patterns reveals whether a dog improves, declines, or maintains consistency across starts.
Race Grade
The grade indicates competitive level. GBGB tracks use grades from A1 through A10, with A1 representing elite company and A10 the most modest racing class. OR denotes open races without grade restrictions. The current race grade appears alongside the grades of previous races, showing whether a dog faces similar competition or steps up or down in class.
Best Time and Track
The best recorded time for the specific distance appears, usually with the track abbreviation where it was achieved. Romford times carry different significance than those from larger or smaller circuits. Calculated times, adjusted for track characteristics, help compare dogs who’ve run at different venues. Raw times from the same track provide the most direct comparison points.
Sectional Times
Split times show how quickly a dog covers different race portions. Early pace indicates speed to the first bend. Run-in time shows finishing speed from the final bend to the line. These sectionals reveal running style, distinguishing front-runners who need to lead from closers who finish strongly from behind.
Comments and Remarks
Brief comments describe previous race incidents or running style observations. Phrases like “crowded first bend” or “finished strongly” provide context for form figures. These remarks often contain information not captured by numbers alone, explaining why a promising dog might have underperformed or highlighting improvement signs.
Decoding Form Figures
Form figures constitute the shorthand language of greyhound racing. These sequences of numbers and letters compress entire race histories into compact strings that experienced punters scan instinctively. Developing fluency in reading form separates competent analysts from those merely looking at numbers.
Numerical Positions
Numbers one through six represent finishing positions in previous races. The sequence reads chronologically from oldest on the left to most recent on the right. Most racecards display the last six runs, though some sources show more extensive histories. A form line reading 111234 tells a clear story: consistent winner three runs back who has since finished second, third, and fourth in subsequent outings. The trend matters as much as individual positions.
Letter Codes and Their Meanings
Letters replacing numbers indicate specific incidents or outcomes worth noting. F denotes a fall during the race, a serious matter that can affect subsequent confidence. W means the dog ran wide, typically losing ground on bends by drifting from the rail. B indicates bumping or interference from other runners. T signifies the dog trialled rather than raced competitively.
Additional codes include S for slipped collar at the start, failing to leave the traps cleanly. M indicates moved to a different trap from the one initially assigned. R shows the dog was brought back from retirement. These codes provide crucial context that raw numbers cannot capture.
Pattern Recognition
Reading patterns across multiple races reveals more than individual positions suggest. A sequence of 654321 shows steady improvement across six runs, a greyhound finding form at exactly the right moment. Conversely, 123456 suggests declining performance requiring explanation, whether through competition level changes, fitness issues, or other factors.
Consistency markers matter significantly. A dog with form reading 222222 always performs near the front without quite winning, potentially needing a trap advantage or reduced competition to break through. Compare this to 164251, where wildly inconsistent results suggest unreliability regardless of ability on best days.
Contextual Analysis
Form figures require context to interpret properly. That impressive 111 sequence carries different weight depending on competition grade. Three wins in A8 company followed by a step up to A6 tells a different story than three wins already at A2 level. Similarly, trap changes between races affect how positions should be read. A fifth-place finish from trap six might represent better running than numbers suggest if inside draws dominated.
Distance changes also affect interpretation. A dog showing poor form over 400m might have sprinting form at 225m worth examining. Switching distances sometimes rejuvenates careers or exposes limitations that numbers alone obscure.
Recent Form Priority
Recent results carry more predictive weight than older performances. Fitness, confidence, and competitive level fluctuate constantly. A dog showing 654111 improved dramatically through the sequence, with the most recent win being most relevant to upcoming chances. Older poor form matters less than current trajectory when assessing live prospects.
Understanding the Grade System
The grading system organises greyhound racing into competitive tiers where dogs face opponents of similar ability. GBGB-licensed tracks, including Romford, operate grades from A1 at the pinnacle down to A10 at entry level. Understanding how grades function transforms racecard reading from surface scanning to genuine competitive analysis.
Grade Structure Explained
A1 represents elite racing, reserved for the fastest and most consistent performers. These greyhounds compete for the largest prizes against peers demonstrating exceptional ability. Moving down through A2, A3, and beyond, each level contains dogs suited to progressively slower target times. A10 racing accommodates newcomers and veterans whose best days have passed.
Professor Madeleine Campbell, GBGB’s Independent Director and EBVS Specialist in Animal Welfare, emphasised the importance of structured competition when launching the “A Good Life for Every Greyhound” welfare strategy. As she stated: “In leading the development of this strategy, I wanted to produce something that would bring about a step change in the way registered greyhounds are cared for throughout their lives.” The grading system embodies this philosophy by ensuring fair competitive matching while supporting greyhound welfare.
Promotion and Relegation
Dogs move between grades based on recent performances, operating similarly to league systems in other sports. Winning races earns promotion to higher grades where competition stiffens. Consistent poor finishing results in relegation to lower grades offering more suitable opposition. This mechanism maintains competitive balance within each grade level.
The timing of grade changes matters considerably. A dog promoted immediately after winning now faces tougher rivals, potentially explaining a sudden form dip. Conversely, a recent relegation might see a decent performer temporarily dominate weaker opposition before adjustment. Reading grade changes within the form sequence reveals these competitive context shifts.
Open Races and Special Categories
OR designation indicates open races without grade restrictions, typically attracting higher-quality fields competing for enhanced prize money. Category races divide by sex, age, or distance specialism. Puppy grades accommodate young dogs still developing, while veteran categories cater to older competitors.
Some races carry specific distance or trap restrictions, creating conditions that favour particular profiles. A 575m open race demands different attributes than a 225m sprint handicap. Reading which race types suit individual dogs helps identify where they hold genuine winning chances versus where conditions work against them.
Grade Comparison Across Tracks
Grade standards vary somewhat between tracks based on local competition depth. An A4 performer at a strong metropolitan track might compete effectively at A2 or A3 level at a smaller provincial venue. When dogs transfer between tracks, their initial grading requires assessment against local competition. Romford, as London’s sole surviving track, draws greyhounds from various backgrounds, making grade interpretation particularly important for those following transfers.
Understanding grades enables proper evaluation of form figures. That recent victory means more when achieved in A3 than A8. Equally, a disappointing fourth in an open race against elite opposition reflects better than identical form in lower grades suggests.
Time Analysis: Best Times and Sectionals
Timing data provides the most objective performance measurements available in greyhound racing. While form figures show relative positions against varied opposition, times reveal absolute speed capabilities. Mastering time analysis unlocks insights invisible to those focused solely on finishing positions.
Understanding Best Times
Every racecard displays the best recorded time for each dog at the relevant distance. Romford’s standard 400m course produces typical winning times between 24.50 and 25.50 seconds depending on grade and conditions. The track record stands as the benchmark against which all performances measure. Elite greyhounds clock times approaching track records, while modest performers run several lengths slower.
Best times require contextual interpretation. A time recorded on fast going differs significantly from one run on rain-affected surfaces. Tailwinds assist times while headwinds slow them. Romford’s track maintains consistent surfaces, but conditions vary seasonally and with weather patterns affecting how times should be compared.
Calculated Times
Calculated times adjust raw performances for specific race conditions, theoretically providing standardised comparisons. These calculations factor in going conditions, wind effects, and race dynamics to estimate what a dog might have run under standard conditions. While useful for cross-track comparisons, calculated times remain estimates rather than definitive measurements.
The gap between actual and calculated times sometimes reveals interesting information. A dog whose calculated time significantly exceeds actual performance may have encountered trouble during the race, whether through interference, poor trapping, or racing wide. This discrepancy suggests more ability than raw results indicate.
Sectional Splits
Sectional times break races into component phases, typically measuring early pace to the first bend and run-in speed from the final bend to the finishing line. These splits reveal running styles that aggregate times obscure. A dog recording fast early sections followed by slower finishing splits differs fundamentally from one showing moderate early pace but strong closing speed.
At Romford’s 400m distance, the split between early and late sections indicates whether a dog leads or rallies. Front-runners need clean breaks and uncontested leads to perform best. Closers require pace to run at and often benefit when early speed dogs tire through racing too keenly.
Applying Time Analysis
Comparing sectional profiles within a race identifies which running styles might prevail. When multiple early pace dogs occupy inside traps, congestion becomes likely, potentially benefiting wider-drawn closers. Alternatively, a race lacking genuine early speed might allow a front-runner to dictate matters unchallenged.
Time improvements across recent races indicate fitness gains or confidence building. A dog shaving hundredths off each performance demonstrates upward trajectory regardless of finishing positions. Deteriorating times suggest the opposite, warranting caution even if placings remain steady against weakening opposition.
Distance suitability shows clearly through times. A dog with excellent 225m sectionals but mediocre 400m times probably lacks stamina for standard trips. Conversely, strong run-in times at 575m suggest genuine staying ability worth noting for longer distance races.
Trainer and Kennel Information
Trainer statistics represent one of the most undervalued racecard elements among casual bettors. Professional punters pay close attention to kennel form, recognising that trainer ability significantly influences outcomes beyond individual greyhound quality. The human element matters more than many realise.
Strike Rate Analysis
Trainer strike rate measures the percentage of runners that win from total entries. Industry-wide, average strike rates hover around sixteen percent, reflecting the six-dog fields where equal chances would produce exactly that figure. Trainers consistently exceeding twenty percent demonstrate genuine competitive edges, whether through better dog selection, superior conditioning, or astute race placement.
Strike rates at specific tracks often diverge from overall figures. A trainer achieving twenty-five percent at Romford while managing only twelve percent elsewhere clearly understands something about the local circuit. Track familiarity, surface preferences, and established racing lines all contribute to venue-specific advantages. Regular Romford trainers typically outperform occasional visitors.
Kennel Specialisation
Different kennels develop reputations for specific strengths. Some trainers excel with sprinters, producing quick-breaking dogs suited to 225m dashes. Others build stayers capable of grinding out 575m contests or beyond. Distance specialisation reflects training methods, dog selection criteria, and often kennel infrastructure suited to particular preparation approaches.
Grade patterns also reveal specialisations. Certain trainers dominate A6 through A8 races without matching that success at higher levels. Others focus exclusively on open-class competition, maintaining smaller strings of elite performers rather than volume operations across grades. Recognising these patterns helps identify where specific kennels hold genuine edges.
Current Form Trends
Kennel form fluctuates across seasons and individual dogs’ careers. A trainer experiencing a hot streak deserves following until results suggest the run has ended. Conversely, previously successful operations sometimes struggle through periods of rebuilding or misfortune requiring patience. Recent results matter more than historical reputation when assessing current kennel strength.
Resources like Greyhound Data provide trainer statistics enabling systematic analysis rather than impression-based judgments. Tracking win percentages, place rates, and profit/loss figures across meaningful sample sizes separates genuine patterns from random fluctuation.
Trainer Moves and Signals
Dogs transferring between kennels sometimes improve dramatically under new management. A change of trainer appearing in recent form often precedes performance shifts worth monitoring. Equipment changes, distance adjustments, or simply different training approaches can unlock previously hidden potential. These transitions represent opportunities for alert racecard readers.
Putting It All Together
Theory transforms into practical skill through systematic application. Working through actual racecard analysis demonstrates how individual elements combine into coherent assessments. The process requires discipline, but the methodology applies consistently across any race at any GBGB track.
A Step-by-Step Framework
Begin with trap draws before examining individual dogs. Identify which positions historically favour winners at the specific distance. At Romford’s 400m, inside traps typically hold advantages through bend geometry, though this varies with field composition. Note which traps contain early pace and which house known closers. The race shape often becomes apparent before studying form in detail.
Next, scan recent form figures for each runner. Eliminate obvious non-contenders showing consistent poor form or significant class drops suggesting declining ability. Identify which dogs demonstrated recent winning form or improvement trends. This quick pass narrows focus to genuine contenders deserving deeper analysis.
For shortlisted dogs, examine times and sectionals carefully. Compare best times at the specific distance, adjusting mentally for grade levels at which they were achieved. Check sectional profiles to understand running styles. Identify potential front-runners and likely closers. Consider how these styles might interact given trap positions.
Practical Example Analysis
Consider a hypothetical A4 400m race at Romford’s Friday evening meeting. Trap one shows form reading 322114 with a best time of 24.71, strong early sections, and a trainer hitting eighteen percent at the track. Trap three displays 445532, best time 24.68, moderate sectionals throughout, from a trainer managing twelve percent locally.
Initial assessment favours trap one despite slightly slower best time. The recent form trend improves rather than declines. The inside draw suits a dog with early pace confirmed by sectional data. The trainer outperforms track average significantly. Trap three’s marginally quicker time came against unspecified opposition and the form trajectory concerns despite consistent placings.
Further analysis examines remaining runners. If trap five shows 116521 with explosive early sections but inconsistent finishing, that runner complicates matters by potentially taking trap one into early pressure. The racecard reveals whether trap five recently switched to this distance or historically shows unpredictable form patterns. Such details reshape initial assessments.
Common Mistakes to Avoid
Focusing exclusively on last-time-out results ignores meaningful trends visible across longer form sequences. A single poor run following five wins might reflect trouble rather than declining ability. Equally, one good run amid consistent mediocrity rarely indicates transformation worth backing.
Over-weighting times without grade context misleads regularly. Fast times in A8 company indicate different absolute ability than modest times against A2 opposition. The competition matters as much as the clock. Read the card, not the hype, and that includes hype generated by impressive-looking numbers requiring context.
Ignoring trainer information wastes freely available edges. Two dogs with identical form figures and similar times become distinguishable through kennel analysis. The greyhound from the trainer running hot deserves preference over the one from a struggling operation, all else being equal.
Building Expertise Over Time
Systematic racecard reading improves through repetition. Reviewing past selections against actual results identifies weaknesses in analysis. Patterns emerge over hundreds of assessments that remain invisible across smaller samples. Keeping records, whether formal spreadsheets or simple notes, accelerates learning significantly. The best racecard readers developed their skills through years of attentive study, not natural gifts requiring no cultivation.
Important Information
This guide provides educational content about greyhound racecard interpretation for informational purposes only. Nothing contained here constitutes betting advice or recommendations to wager money on any specific outcome. Greyhound racing involves inherent uncertainty, and past performance never guarantees future results.
If you choose to bet, do so responsibly and within your financial means. Set strict limits before wagering and never chase losses. Help is available through BeGambleAware and the National Gambling Helpline for anyone experiencing gambling-related difficulties. You must be eighteen or older to place bets in the United Kingdom.
Data referenced throughout this guide comes from publicly available sources including GBGB Racing and independent statistical services. This publication maintains no official affiliation with Romford Stadium, GBGB, or any licensed bookmaker. Track records and statistics current at time of writing may change as new performances occur.